Sep 28, 2018
4 Charts Every Investor Should Know
Written By: Nate Williams
(This blog post, 4 Charts Every Investor Should Know, was compiled and revised from a newsletter sent out by Loring Ward, our investing partner).
Sometimes a picture really is worth a thousand words. In this post, I’ll share four charts that I believe every investor should understand. These charts focus on some of the basics of investing, like focusing on the long term, diversification, and not letting emotions drive your portfolio.
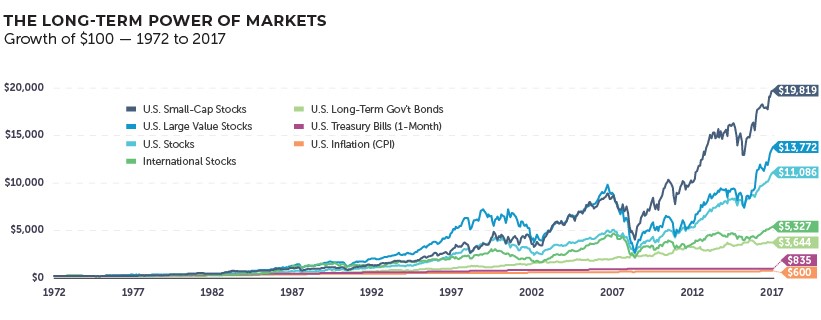
#1: Let Markets Work for You
Good things come to those who wait—and to those who don’t let short-term news events scare them out of staying invested for the long-term. Every generation of investors has had its reasons to worry and pull out of the market from the Great Depression, World War II, and Vietnam of earlier generations, to the more recent Black Monday, dot com bubble, and Great Recession. But if you had invested $100 in the U.S. stock market back in 1972 and left it alone all those years, that $100 would have grown to $11,086 by the end of 2017. Decade after decade, markets around the world have been significant generators of long-term wealth for patient, diversified investors.
(see footnote #1)
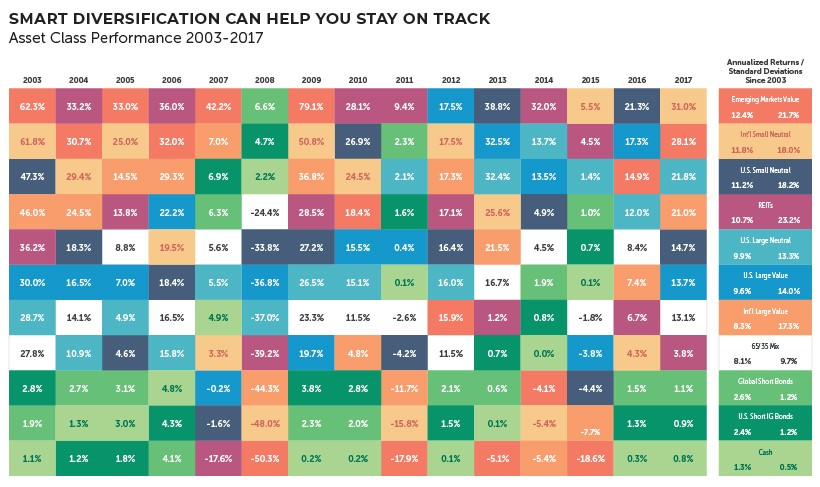
#2: Stay on Track with Diversification
Investing is not unlike a healthy diet. You don’t eat the same thing every day for breakfast, lunch, and dinner. Likewise, with investing you also want a variety. Shown in the chart below are a number of asset classes, such as International, REITs, Short-Term Bonds, etc. But diversification is more than just “spreading things around.” Different asset classes are combined to both maximize the expected return and minimize the risk (or volatility) of a portfolio.
(see footnote #2)
As you can see, even though an asset class is on the top one year (Emerging Markets Value in 2007), that same asset class may be at the bottom the next year (Emerging Markets Value in 2008). Rather than trying to predict the winners and losers, keep a balanced, globally diversified portfolio (like the one shown in white) to help you stay on track toward your goals. You won’t be the single best performer in any period, but you also have fewer reasons to worry about poor returns from a single asset class. Additionally, it can help your portfolio get you where you want to go. (Notice that the portfolio in white has the highest return relative to the standard deviation when compared to the other equity asset classes).
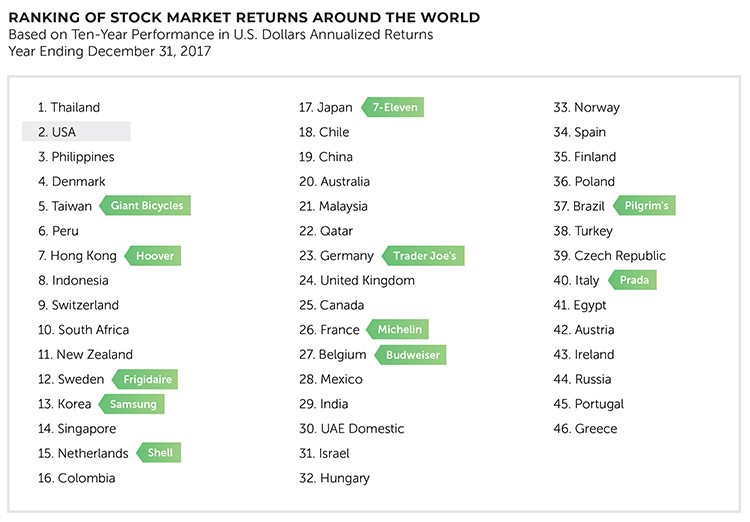
#3: Own Great Companies Around the World
America may be #1 in our hearts, but there are many other countries with great companies to invest in. The average U.S. investor has a portfolio made up of about 75% U.S. stocks, which seems patriotic, but can mean missing out on a world of opportunity. You might be surprised by the number of familiar companies and household brands that are internationally owned, such as Samsung, Michelin, Frigidaire, and even 7-Eleven. No one can predict which country will be the top performer (and the U.S. has never been the top performer over any 10-year span of time), but if you own a lot of companies around the world, you can worry less if any one company or even one country experiences losses.
(see footnote #3)
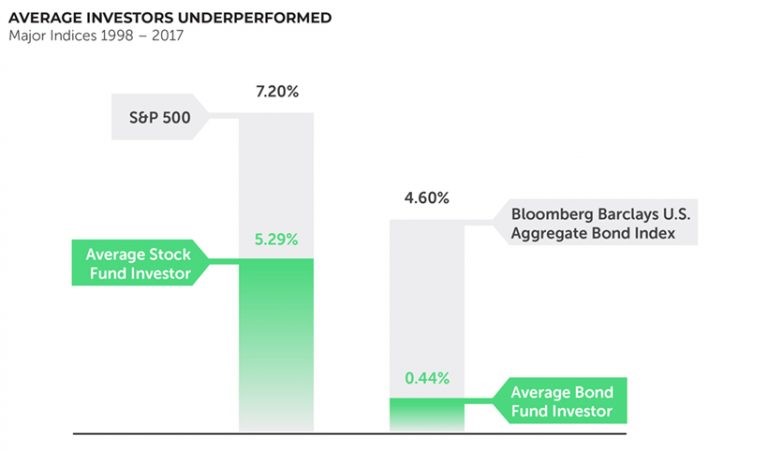
#4: Stop Changing Lanes
Don’t try to time getting in and out of the market. It’s like trying to go faster on a crowded freeway by constantly changing lanes, only to discover you are going slower than if you had just stayed in the lane you were in. Over the past 20 years, the S&P 500 returned an annual average of 7.20%, but typical U.S. stock investors earned just 5.29%, primarily because they tried to outsmart the market but kept getting in and out at the wrong times. Many investors think they know when to buy and sell. But this means they have to be right twice: picking the right time to get out and the right time to get back in. Other investors make emotional decisions, like pulling out of the market when stocks are losing.
This is where the experience and guidance of your financial advisor can make all the difference and help you stay “in your lane” and headed towards your goals.
(see footnote #4)
Hopefully these charts can further teach some of the time-tested investing principles that will continue to serve investors in any economy. These are:
- Stay focused on the long-term and let the markets work for you
- Stay diversified
- Own great companies around the world
- Stop “changing lanes.” Stay the course and stay invested.
Footnotes:
- Hypothetical value of $100 invested at the beginning of 1972 and kept invested through December 31, 2017. Assumes reinvestment of income and no transaction costs or taxes. This is for illustrative purposes only and not indicative of any investment. Total returns in U.S. dollars. Past performance is no guarantee of future results. Data source: Morningstar Direct and Dimensional’s Returns 2.0. U.S. Stocks: Fama/French Total U.S. Market Index Portfolio. U.S. Large Value Stocks: Fama/French U.S. Large Value Index (ex utilities). U.S. Small-Cap Stocks: CRSP Deciles 6-10 Index. International Stocks: MSCI EAFE IndexNet. U.S. Long-Term Gov’t Bonds: Long-Term Government Bonds. U.S. Treasury Bills (1-Month): One-Month U.S. Treasury Bills. U.S. Inflation (CPI): Consumer Price Index for All Urban Consumers (CPI-U). Indexes are unmanaged baskets of securities that investors cannot directly invest in. Index performance does not reflect the fees or expenses associated with the management of an actual portfolio.Risks associated with investing in stocks potentially include increased volatility (up and down movement in the value of your assets) and loss of principal. T Bills and government bonds are backed by the U. S. government and guaranteed as to the timely payment of principal and interest. T Bills and government bonds are subject to interest rate and inflation risk and their values will decline as interest rates rise.
- Source: Morningstar Direct 2018. Cash (BofAML 3M U.S. Treasury Note TR U.S.D). Index representation as follows: U.S. Large Neutral (S&P 500 Index), U.S. Large Value (Russell 1000 Value TR Index), U.S. Small Neutral (Russell 2000 TR Index), REITs (Dow Jones U.S. Select REITs TR Index), International Large Value (MSCI World Ex U.S.A Value Index (net div.)), International Small Neutral (MSCI World Ex U.S.A Small Cap (net div.)), Emerging Markets Value (MSCI Emerging Markets Value Index (net div)), Global Short Bonds (Citi WGBI 1-5Yr Hdg U.S.D), U.S. Short Investment Grade Bonds (BofA ML Corp & Govt 1-3 Yr TR). 65/35 Index Mix: 2% Cash, 16% U.S. ST Bonds, 17% Global ST Bonds, 15% U.S. Large Neutral, 12% U.S. Value, 8% U.S. Small Neutral, 14% Int’l Large Value, 7% Int’l Small Neutral, 5% Emerging Markets Value, 4% REITs; rebalanced annually. Diversification does not guarantee profit or protect against loss in declining markets. Asset allocation does no assure or guarantee better performance and cannot eliminate the risk of investment losses. Indexes are unmanaged baskets of securities that are not available for direct investment by investors. Index performance does not reflect the expenses associated with the management of an actual portfolio. Past performance is not a guarantee of future results. All investments involve risk, including loss of principal. Foreign securities involve additional risks, including foreign currency changes, political risks, foreign taxes, and different methods of accounting and financial reporting. Fixed income investments are subject to interest rate and credit risk. Emerging markets involve additional risks, including, but not limited to, currency fluctuation, political instability, foreign taxes, and different methods of accounting and financial reporting. Real estate securities funds are subject to changes in economic conditions, credit risk and interest rate fluctuations.
- Source: Morningstar Direct 2018. Countries represented by their respective MSCI IMI (net div.). Past performance is not indicative of future results. Securities listed are for illustrative purposes only and are not to be viewed as investment recommendations.
- Average stock investor and average bond investor performances were used from a DALBAR study, Quantitative Analysis of Investor Behavior (QAIB), 04/2018. QAIB calculates investor returns as the change in assets after excluding sales, redemptions, and exchanges. This method of calculation captures realized and unrealized capital gains, dividends, interest, trading costs, sales charges, fees, expenses, and any other costs. After calculating investor returns in dollar terms (above), two percentages are calculated: Total investor return rate for the period and annualized investor return rate. Total return rate is determined by calculating the investor return dollars as a percentage of the net of the sales, redemptions, and exchanges for the period. The fact that buy-and-hold has been a successful strategy in the past does not guarantee that it will continue to be successful in the future. S&P 500 returns do not take into consideration any fees.